


Our normal pattern is to issue a quarterly market commentary. In periods of heightened market volatility, however, we strive to communicate more frequently. For instance, amidst the onset of the pandemic from March 4th to April 2nd of 2020, we issued four market commentaries.
Given the equity market’s declines and the bond market’s historic losses, we want to offer some perspectives regarding the financial markets’ shifting landscape. Suffice it to say, while we seem to have moved beyond the health-related confines of the pandemic, higher interest rates and Russia’s war with Ukraine have quickly squashed investors’ appetite for risk assets. Consistent with our approach for more than two decades, we won’t pretend to know how markets will fare in the near-term. We will, however, reiterate our view that when asset prices go lower, the risks to investors are reduced not increased. Consequently, for investors with a long-term time horizon, we are more likely to buy versus sell stocks amidst the current volatility.
Of course, we recognize increasing equity exposure in a market downdraft can be an uncomfortable proposition. We have taken strides to align our clients’ investment portfolios with their goals and risk tolerances but recognize those can change. Therefore, please reach out if you have questions about any investment activity in your portfolio or want to discuss the financial markets and your financial position in more detail.
The Stock Market Leaders Have Quickly Become the Laggards
Six consecutive weeks of broad market declines have left the S&P 500 deep in correction territory down 16% for the year as of May 9th. The growth stock-heavy NASDAQ, an investment bright spot during the Covid crisis, has declined 25% for the year. A strengthening dollar and war in Europe have weighed on non-U.S. stocks, which have lost 16% (MSCI All Country World ex U.S.).
In sharp contrast, the CRSP US Large Cap Value index has fared relatively well- down 5% year-to-date. The index has been helped in part by gains from stocks in the utilities, staples, and energy sectors. As we’ve discussed in recent market commentaries, rising interest rates tend to negatively impact higher multiple growth stocks much more than lower multiple dividend stocks. That has proven to be the case thus far in 2022.
The performance of the broad market indices somewhat masks the extent of the underlying carnage for certain sectors and types of stocks. For instance, the average stock in the NASDAQ is down 45% for the year. Almost 60% of stocks in the S&P 500 are 20% off their 52-week highs and over 70% of small-cap stocks are down 20% or more.
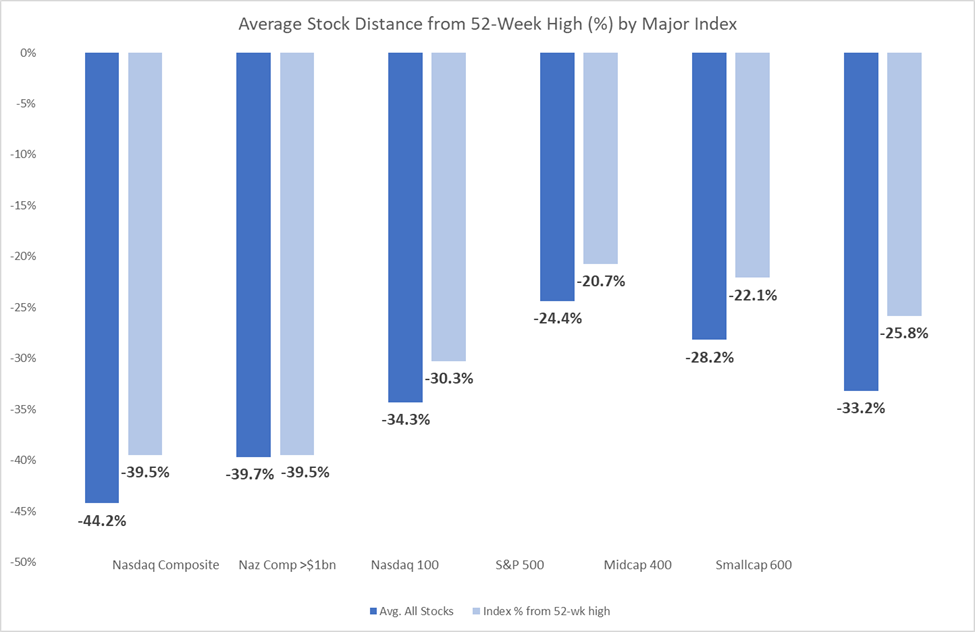
The much-discussed ARK Innovation ETF, which more than doubled in 2020, is down 56% this year and now below 2018 prices. High-profile stocks such as Netflix, FaceBook (Meta), and Amazon have all declined more than 30% this year. Whereas, longstanding blue-chips such as Coca-Cola, Johnson & Johnson, Merck, Chevron, and Duke Energy, which lagged in 2021, are up year-to-date. While value stocks in general still lag growth stocks over the last few years, the first part of 2022 has helped to close that gap.
The Best Bond Yields in Years
Bonds have experienced historic declines due to the impact of rising interest rates. For instance, the Barclays Intermediate Government Credit index is now down 7%. The total bond market index, which includes bonds with maturities up to thirty years, is down 10% (Bloomberg U.S. Aggregate Index). Considering investor expectations that bonds will hold their value, reinforced by decades of steadily declining rates, the sell-off has caused significant angst and for many investors, a crash course in understanding duration risk in a bond portfolio.
Perhaps the shift in the yield curve best illustrates the magnitude of the rate change the past month, let alone, since the beginning of the year. For instance, a two-year Treasury yielded 0.7% on January 1, 2.5% one month ago, and now 2.7%. While the curve is still relatively flat, the ten-year Treasury yield is currently above 3% compared to 2.6% last month and 1.5% in January.
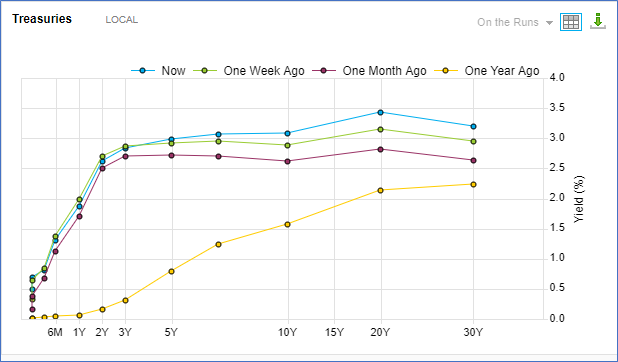
Source: FactSet Data Systems
If the heightened expectations still underappreciate the inflation threat, bond prices (and particularly long bond prices) will fall further. Today’s reduced prices, however, offer meaningful rates of return for even short-term bonds. Limiting the exposure to short-term bonds allows investors to earn income without assuming significant interest rate risk. As a result, we are investing cash earning very little in high-quality fixed-income government and corporate securities with duration of two to four years.
Investor Sentiment: Where Did All the Bulls Go?
According to the American Association of Individual Investors, investors’ outlook is as pessimistic as it has been since the market lows of March 2009. Anyone investing in 2009 can appreciate just how gloomy this investor sentiment reading is.
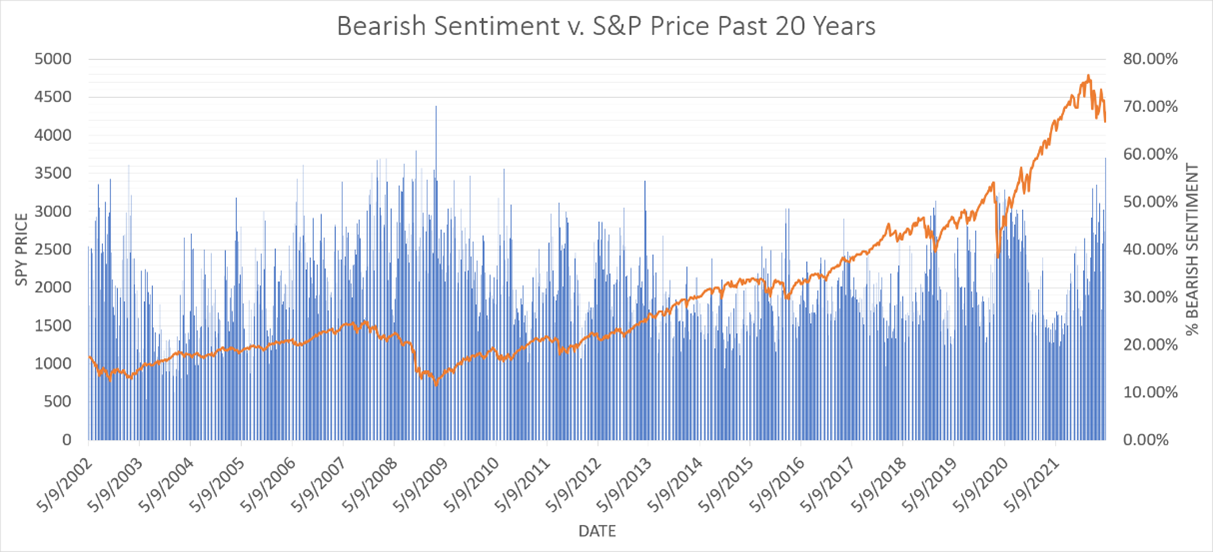
Source: Woodmont & American Association of Individual Investors
Historically, sentiment data like this is more bullish than bearish and usually follows market declines versus anticipating them. While no one can argue about the extent or legitimacy of investors’ concerns, the challenge is always determining how much the market has already anticipated them. Per the chart above, the gloomy days of March 2009 coincided with the market bottom for the Great Financial Crisis.
Market Valuations: No Longer at the Top End of the Range
The forward P/E valuation multiple for the S&P 500 has contracted nearly 5 multiple points since the beginning of the year and is now 17.5X. Excluding the top ten companies in the index, the other 490 are valued at a P/E multiple of 15.2X. The twenty-five year average forward P/E for the S&P 500 is 16.9X.
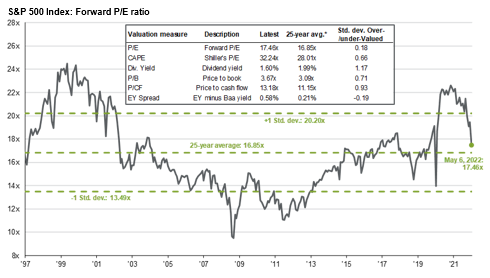
Source: JP Morgan Guide to the Markets
Many of the high-profile or recently public growth stocks remain expensive, despite as much as 60% to 80% price declines in recent months. Unfortunately, most of those stocks had been valued on a multiple of sales versus earnings basis. While popular in evaluating growth companies with large market opportunities, this method presents challenges when sentiment shifts and investors want to understand the traditional and earnings derived “margin of safety” for a stock.
As for the broader market, investor concerns seem to be focused on the forward aspect of the “E” in the P/E equation. First quarter earnings and outlooks have remained strong in the aggregate, increasing 12% year over year. Yet, the impact to corporate margins of higher input costs and tightening credit, not to mention escalating financings costs and $4 plus per gallon gasoline facing consumers, may not be fully reflected in today’s estimates.
Time will tell whether the earnings outlook falters. We are encouraged, however, by the strength of household balance sheets and an incredibly strong jobs market with nearly two openings for every job seeker. Both factors are supportive of future earnings growth. It also seems investors have digested the Federal Reserve’s inflation-fighting message, which should reduce the shock of future rate hikes. Yet perhaps most noteworthy of all, the market’s lower P/E multiple has certainly reset the investor expectations bar.
As always, thank you for your continued trust and confidence. We look forward to answering your questions.
This document contains general information only and is not intended to be relied upon as a forecast, research, investment advice, or a recommendation, offer, or solicitation to buy or sell any securities or to adopt any investment strategy. The information does not take into account any reader’s financial circumstances or risk tolerance. An assessment should be made as to whether the information is appropriate for you with regard to your objectives, financial situation, present and future needs.
The opinions expressed are of the date of publication and may change as subsequent conditions vary. The information and opinions contained in this material are derived from proprietary and non-proprietary sources deemed by Woodmont to be reliable, are not necessarily all inclusive and are not guaranteed as to accuracy. There is no guarantee that any forecasts made will come to fruition. Any investments named within this material may not necessarily be held in any accounts managed by Woodmont. Reliance upon information in this material is at the sole discretion of the reader. Past performance is no guarantee of future results.