


We have seen many Bull and Bear arguments come, go, and repeat over our firm’s 25-year history. While admittedly the Bull case gets more difficult with each record high, we appreciate investors’ natural tendency to focus on the risks and underappreciate the opportunities. This is why the time we commit to understanding our clients’ risk tolerance and risk capacity is crucial to serving them well.
In this commentary, we will discuss interest rates, asset valuations, and major economic variables such as capital investment and demographics. Saying there is plenty to digest may be a historic understatement for this quarterly commentary. Yet, the fact that many of today’s Bull and Bear arguments cut both ways is another reason to focus on the long-term investment plan, not the daily twists and turns.
Lower Interest Rates. Fuel for the Fire or Signs of Real Economic Weakness?
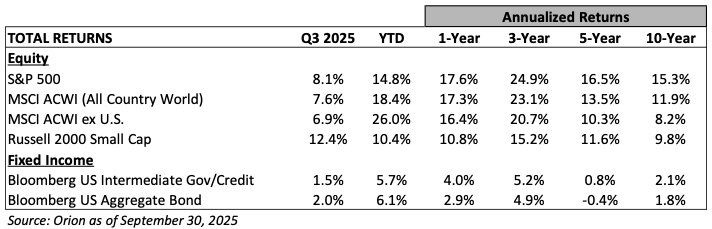
The yield on the Ten-Year U.S. Treasury was 4.8% in January, dropped to 4.5% in mid-July, and finished the quarter at 4.1%. For the first time since October 2024, 30-year mortgage rates fell below 6.5%.

“We have an environment that is highly unusual.” Bond Investor, Jeffrey Gundlach, September 2025 UBS On-Air Podcast
We remain focused on limiting risks within clients’ bond portfolios. While we modestly extended duration earlier in the third quarter for most clients, our bias is to own investment-grade securities and keep duration at half or less of the bond benchmark’s six years. As we have often said, accepting greater risks in exchange for equity capital appreciation has appeal. Taking on additional risks in the “safe” portion of the portfolio is a tougher proposition, particularly given 1) government deficits and mounting debt, 2) historically tight credit spreads (the excess return bond investors receive in exchange for accepting credit risks), and 3) a five-fold increase since 2016 in nontraditional lending, which is now a $1.4 trillion market representing 13% of outstanding loans in the U.S.
S&P 500 Equity Valuations Are Approaching Prior Peaks
The S&P 500 trades at 23x forward twelve months' earnings, while the median stock trades at 19X. In July 2000, the S&P 500 traded at 27X with the median stock at 23X.
Some investors reference the price-to-sales ratio as a more meaningful historical valuation comparison given the variations in accounting standards over the years. Today, the S&P 500 trades at over 3.0X sales compared to a 2.8X peak in the dot-com era. On an equal-weighted basis, we are at 1.8X compared to a historic average of 1.4X. (source: Wall Street Journal)
Much has changed in the equity indices since 2000, including the consolidation of many weaker companies by stronger competitors following stricter regulatory standards. Nevertheless, today’s elevated P/E (the 25-year average is 17X), signs of life in the IPO market, and the return of the “meme” stock fad seem to reflect a “greed” factor more associated with near-term market peaks than bottoms.
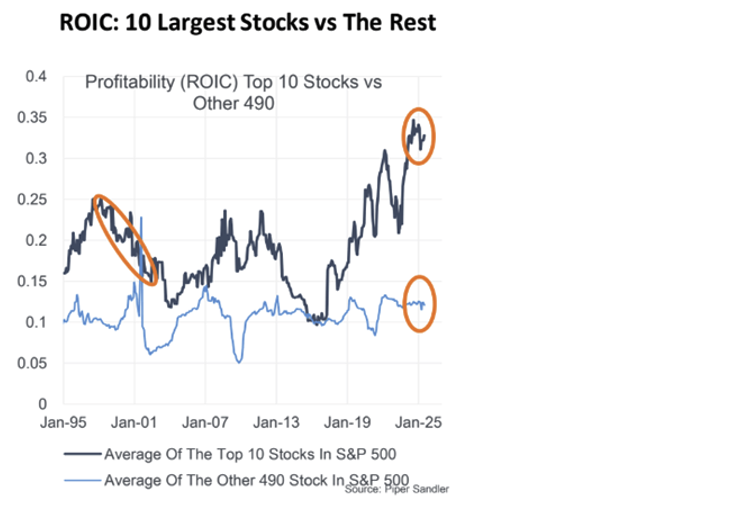
It is also rare to see large companies grow earnings at today’s pace, which would support higher valuations. Specifically, the top ten companies in the S&P 500 are expected to grow earnings 15% in 2025 and 18% in 2026. By contrast, S&P 500 earnings have increased 7% per annum since 2010.
Time will tell if the important big-tech market leaders can sustain this pace of earnings growth and premium valuations. This is certainly a key piece of today’s bull market. In the meantime, we take solace knowing 1) earnings and cash flows remain robust, supporting capital investment, dividends, and buybacks, 2) many companies, sectors, and international stocks are trading at or below their historical valuations, and 3) owning stocks is not a day-to-day scheme but a long-term commitment to a positive trend.
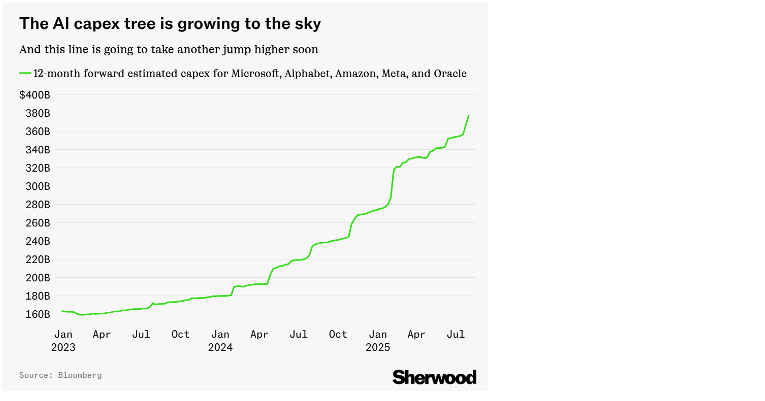
Outside of the AI Capital Tsunami Exists a Main Street Capital Investment Tidal Wave
The capital investments in the AI ecosystem have been well-publicized, including the “circularity” of leading players such as NVIDIA funding the chip purchases of key customers like OpenAI. Nevertheless, as shown in the chart below, five large tech companies alone are expected to spend nearly $400 billion in the next 12 months, mostly on data centers and chips. J.P. Morgan estimates the Magnificent Seven will invest $700 billion in 2025, when including tax-incentivized Research and Development spending.
Historically, this type of investment acceleration requires companies to issue significant debt. However, the Magnificent Seven are projected to generate nearly $800 billion in cash flow from operations this year, which is more than enough to finance these investments without taking on additional debt.
It Still Takes People
A recent MIT study reports that 95% of organizations using AI have yet to see any economic benefits. The current challenge is aligning the AI enhancements with existing workflows. Still, it is tough to envision a future in which businesses and consumers are not doing more in less time and using fewer resources (aside from the energy required to run AI) due to AI advancements.
“Maybe there’s a job in the world that AI won’t change, but I haven’t thought of it.” Wal-Mart CEO, Doug McMillon
While much research focuses on how AI will impact our lives, including the risks it poses to long-term cognitive function, we may not be paying enough attention to how many lives there are. Specifically, the CBO released its updated U.S. population growth forecast in September, which is now just 0.2% per annum. This is less than one-fifth the rate of growth from 1975 to 2024. In 2031, the CBO forecasts there will be more deaths than births and almost 2 million fewer people under age 24 in the U.S.
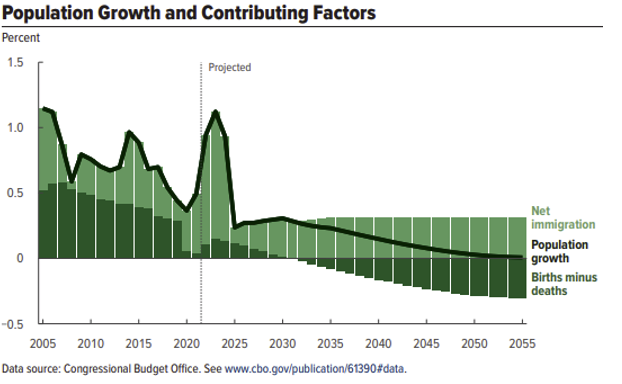
While lower fertility rates in the U.S. have presented a demographic challenge in recent decades, net immigration has helped offset this. With the immigration trend reversing, the population growth offset to lower birth rates is lost. Many U.S. companies stand to benefit from selling goods and services to growing populations around the world. The historical data and our population trends at home, however, indicate we’ll need more people to avoid falling into the sub-2% economic growth cohort.
Thank You for Helping Us Celebrate 25 Years!
We appreciate everyone who joined our celebration on September 20th and are grateful to all our clients who have made 25 years possible. It is an honor to work with so many terrific people. It is also an exciting time at Woodmont as we continue to look for ways to better serve clients. Along these lines, we have started the process of hiring two new team members for early 2026.
In addition to growing our team to serve you better, we have prepared several white papers discussing important planning topics such as Social Security, charitable gifting strategies, and the recently passed tax legislation. These are available on our website. If we haven’t connected recently, or you have questions regarding these updates, please reach out so we can help you navigate the relevant changes before year-end.
Thank you for your continued trust and confidence. We look forward to answering your questions and assisting in any way we can.
The Woodmont Team
October 1, 2025
This document contains general information only and is not intended to be relied upon as a forecast, research, investment advice, or a recommendation, offer, or solicitation to buy or sell any securities or to adopt any investment strategy. The information does not take into account any reader’s financial circumstances or risk tolerance. An assessment should be made as to whether the information is appropriate for you with regard to your objectives, financial situation, present and future needs.
The opinions expressed are of the date of publication and may change as subsequent conditions vary. The information and opinions contained in this material are derived from proprietary and non-proprietary sources deemed by Woodmont to be reliable, are not necessarily all inclusive and are not guaranteed as to accuracy. There is no guarantee that any forecasts made will come to fruition. Any investments named within this material may not necessarily be held in any accounts managed by Woodmont. Reliance upon information in this material is at the sole discretion of the reader. Past performance is no guarantee of future results.