


As the details unfolded, a strong consensus developed that life in America would never be the same. In so many ways, life in America and abroad was changed forever. Yet when we think about the shock of this tragedy and contrast it with the freedom to go and do we have continued to enjoy in the years since (dining out, sporting events, travel, concerts, and playgrounds), the resilience of the American people and our institutions is apparent.
“Are you ready? Okay. Let’s Roll.”
Todd Beamer, citizen hero aboard Flight 93, before leading his fellow passengers in an attempt to stop the hijackers
What is also clear from the reflections on 9/11 is that heroes come in many forms and aren’t always in uniform. One need only visit the 9/11 Museum and Memorial in New York City or the Flight 93 Memorial in Pennsylvania to appreciate and be encouraged by the citizen heroes among us.Tennesseans recently lost one of our greatest citizen heroes. Dolly Parton’s music and generosity inspired people around the globe. Her resilience made her that much more special. One of twelve children raised in a one-room log cabin in East Tennessee, Dolly’s humility, humor, applicable wisdom, and propensity to give others the benefit of the doubt will inspire us for generations to come. The fact Nashville’s airport will soon bear her name is confirmation her laudable character traits are still widely valued.
“You’ll never do a whole lot unless you’re brave enough to try.”
Dolly Parton
The extent of the uncertainties confronting us (e.g., AI, debt, deficits, and global strife), coupled with today’s combative political landscape, no doubt provides some context for the “Dolly for President” stickers long prevalent among Nashville bumpers. We’ve discussed many of these challenges in previous market commentaries and will touch on some again this quarter. We’ve also discussed the resiliency of our financial markets, capitalistic system, and the American people in the face of economic challenges and tragedies. Thinking about 9/11 and Dolly these past weeks have been wonderful reminders of this resiliency, which supports our long-held conviction that investors who can look beyond the challenges of the day will be rewarded.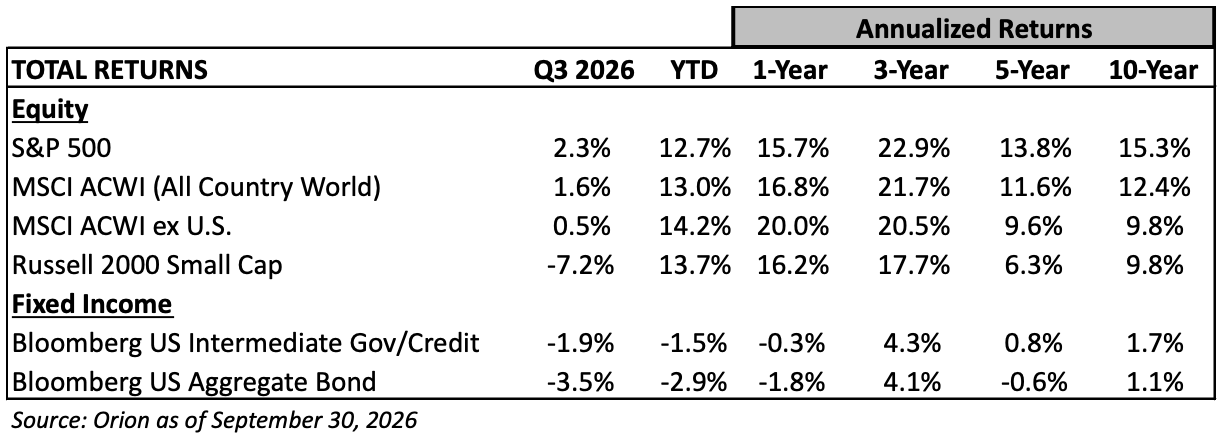
Consumers – How Much More Resilient Can They Be?
Consumer balance sheets are relatively healthy, thanks in part to the stock market and housing gains of recent years. This financial good health has contributed to a 4.5% increase (3.7% ex-gasoline) in consumer credit and debit card spending through August. (Source: BofA Consumer Checkpoint). Spending on conveniences and experiences remains particularly strong.Headwinds to this consumer trend have emerged including 1) the stalling of real wage growth (gains after inflation are negligible), 2) increased costs of everyday goods and services (the regressive tax we have discussed before), and 3) the hit to confidence when it’s not clear whether AI is friend or foe. Adding to the angst are higher interest rates, particularly for those borrowers with variable-rate or soon-to-mature fixed-rate debt obligations.
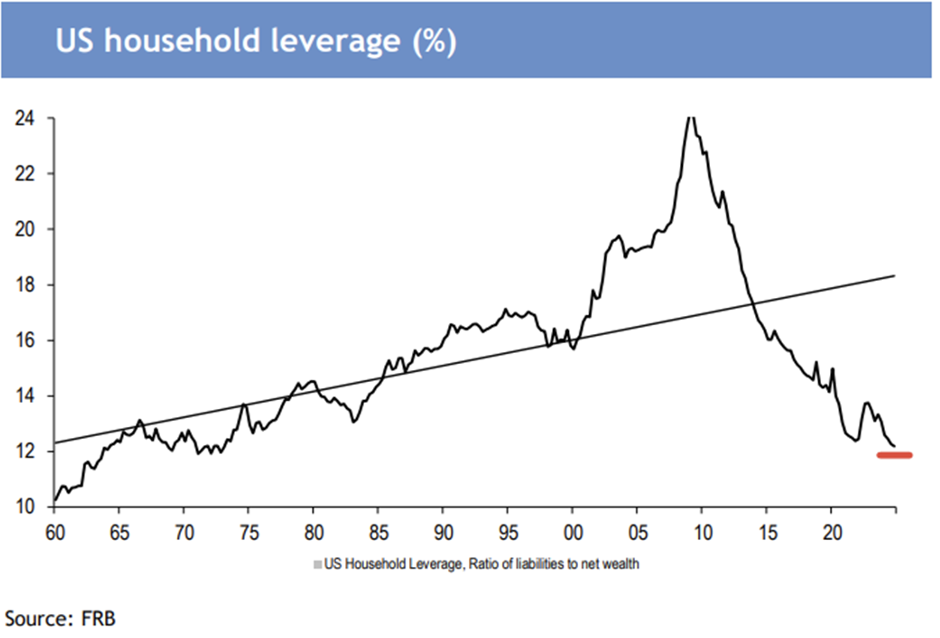
All in all, pockets of employment strength, many retirees and other savers doing well, and the positive wealth effect, provide a reasonable consumer spending backdrop for the important fourth-quarter retail season. To avoid deterioration heading into 2027, however, consumers will need relief from high fuel prices, other inflationary pressures, and some comfort AI won’t take all our jobs or worse!
Investors Are Hardly Euphoric. That’s a Good Sign.
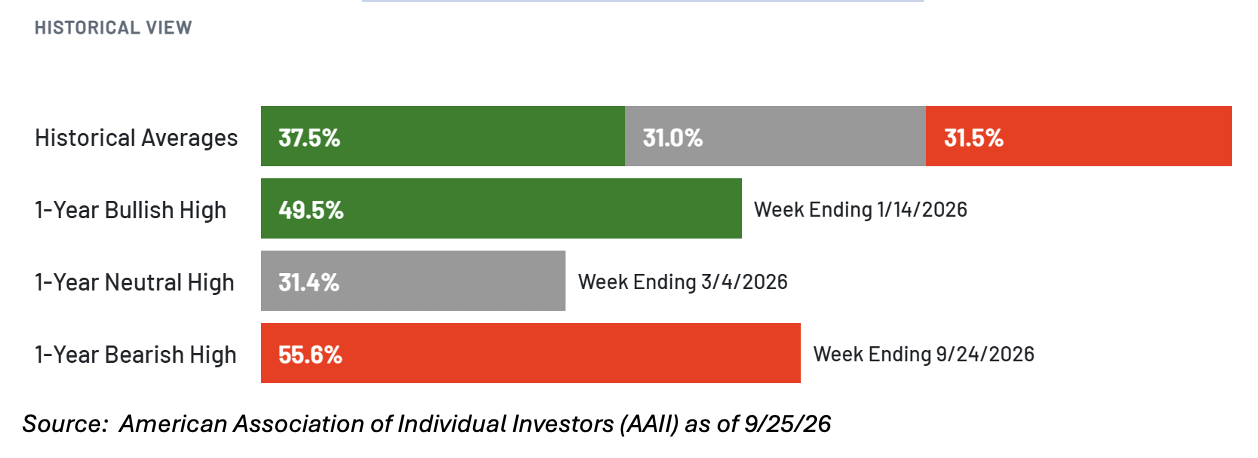
U.S. and non-U.S., small and large, and value and growth equities have all posted 10% or greater gains through the first three quarters of the year. While the number of positive performance contributors narrowed in the third quarter – currently 60% of S&P 500 stocks are down at least 20% from their highs - diversified investors would be hard-pressed to complain about the year-to-date results.Despite these strong gains, late-September’s AAII bull-bear index reading of 56% “bearish” compares to the historical average of 32%. Clearly, the weight of today’s uncertainties are weighing on retail investors.
Fortunately, markets rarely peak when the AAII data is so bearish. In fact, the AAII data has proven to be a contrarian indicator over the years and mirrors our experience that off-the-radar or underappreciated risks, not those on the front pages, are often what derail bull markets.
AAII Recent Bull & Bear Survey Results
The Strong Start to the Decade In Context
Additional context is always helpful, whether trying to understand a data set or perhaps your neighbor’s strong opinions. When considering the impressive equity gains of recent years, we found the historical market returns by decade noteworthy. For instance, according to a recent report by Jefferies & Company, the 125% return thus far for the 2020s is well below the 185% to 300% plus price returns of the 2010s, 1990s, 1980s, and 1950s. Even if the S&P 500 posted 10% annual returns for the next three years, the increase this decade would still fall short of the 185% price gain of the 2010s, let alone the boom decades of the 1950s, 1980s, and 1990s.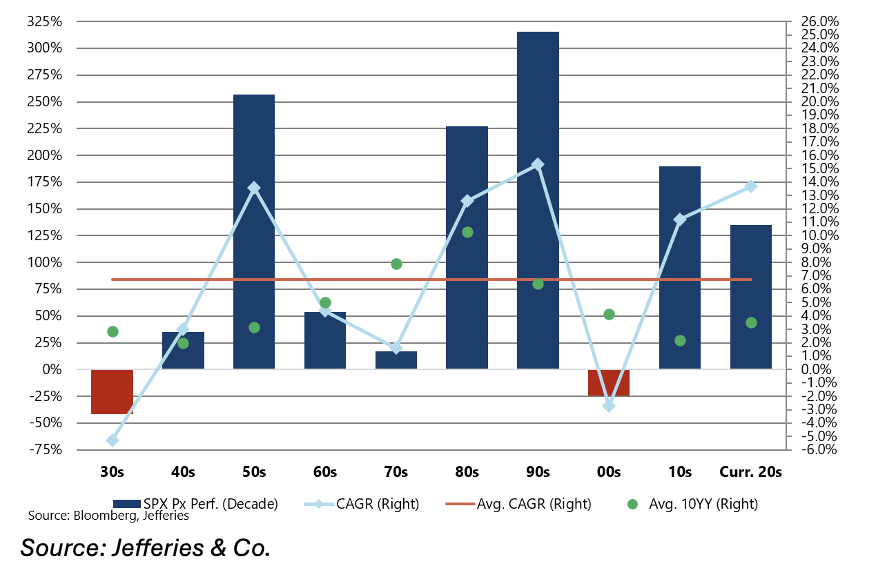
A Powerful Earnings Trend By Any Measure
Reviewing historical market results is often insightful. If nothing else, the gains over the decades outlined in the chart above remind us that markets are capable of extended and significant positive (or negative) runs. Yet when trying to understand the catalyst for these market moves, there is no substitute for evaluating corporate earnings trends.As depicted in the chart below, S&P 500 earnings have increased about 10% per year from 2016 to 2022. Assuming the current estimate for 2026 proves accurate, earnings for the S&P 500 will have grown 14% per year since 2022, pushing ten-year annualized earnings growth to 12%. The net result of this historically strong growth is that even with the nearly three-fold increase in stock prices of the last ten years and doubling since October 2023, today’s P/E ratios of 22X and 19X for 2026 and 2027 estimated earnings are in line with the ten-year averages and about a 20% premium to the twenty-five-year averages.
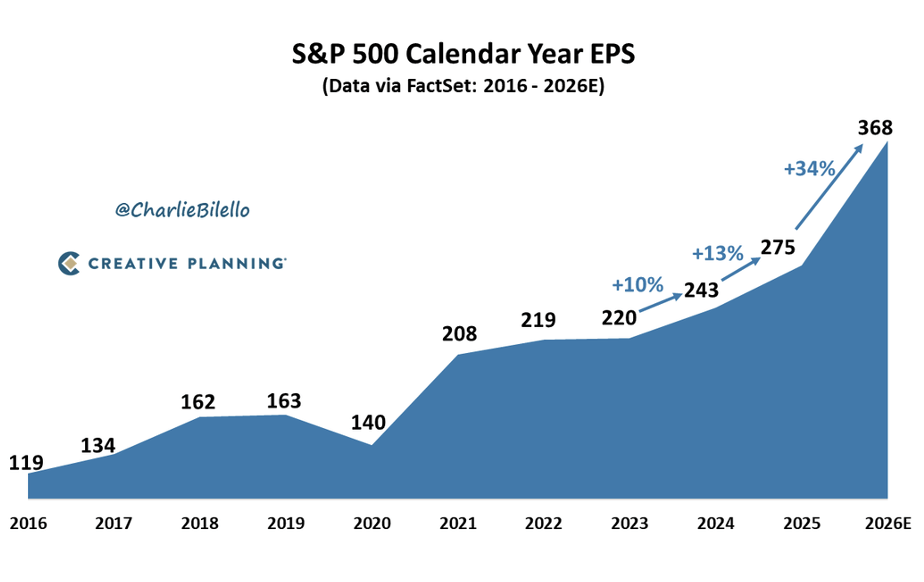
As for the premium, it may speak more to how the index’s composition has changed over the years than whether stocks are currently expensive. Specifically, today’s after-tax corporate profit margins are historically high, largely due to the index’s transition from one where industrial, energy, and consumer stocks carried significant weight to one dominated by technology companies. While we can debate whether these margin improvements are sustainable, shareholders stand to benefit significantly if revenue growth continues.
Investment Numbers We Have Never Seen Before
While no less impressive, the caveat to this earnings strength is its resulting concentration. Technology innovations in general, and AI-related activities more specifically, are perhaps, as the Wall Street Journal described, “Becoming the Biggest Economic Bet in U.S. History.”In our January commentary, we shared estimates that AI-related capital investment was approaching 2% of Gross Domestic Product (GDP). Now, some strategists estimate this investment could approach 4% of GDP by 2032. For context, the railroad expansion averaged 2% of GDP (albeit for 20 years), the interstate highway project 1%, and the broadband buildout of the dot.com era 1%.
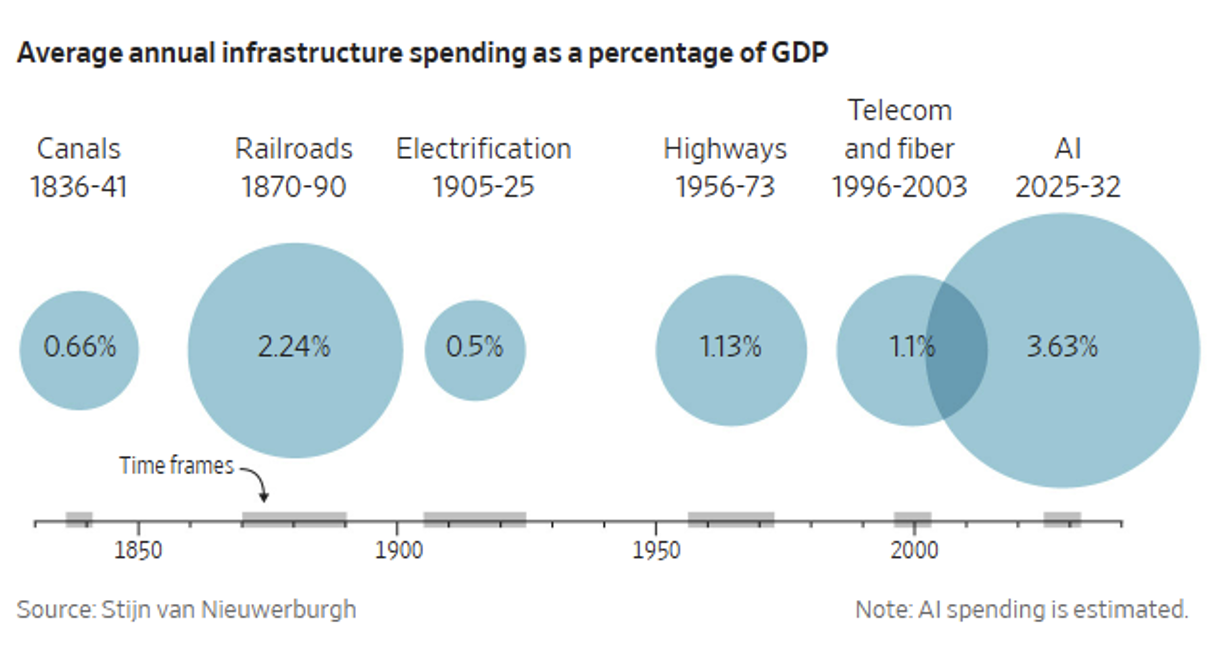
The economic dependence on AI activity has Wall Street and Washington’s attention. A slowdown in capital investment or a change in the capital required to support this innovation (e.g., a shift from large language models (LLMs) to more efficient small language models (SLMs)) will have significant economic implications. Not to mention, the companies making these historically large capital investments will eventually have to account for them as depreciation expense on the income statement. This expense could negatively impact future reported earnings if the investments do not generate the anticipated profits.
A consolation is that the AI investment uptrend has been building over multiple years, and it is tough to imagine that any unwinding wouldn’t take a few years, given the long lead times of these projects. Another is the leverage profile of the largest players that are either funding or backstopping most of this investment remains modest. In fact, cash balances still approximate outstanding debt for the high-profile publicly traded AI participants. This won’t insulate public investors from the economic risks, especially as future obligations pressure corporate leverage profiles. However, the current financial strength of these leading companies should help prevent the sudden crash-and-burn emblematic of the 2000 era, when new stock and debt issuance inflated the bubble.
Treasury Yields Jump. Was $40 Trillion a Trigger?
In recent weeks, the only investment topic receiving more coverage than AI has been the spike in interest rates. Five and ten-year U.S. Treasury yields have increased 0.5% just in the past month and are now roughly 1.2% higher than this time last year. The current 5.3% yield for the Ten-Year U.S. Treasury is the highest since 2007.The interest rate spike was not limited to U.S. Treasuries. Global government bonds saw similar increases, and now non-U.S. sovereign bonds are down 3% for the year. Similarly, municipal and corporate bond prices declined. Largely due to this recent sell-off, the Intermediate US Government/Credit and Municipal Bond indices are both down 3% and 5% year-to-date, resulting in yields on quality corporate and municipal five-year bonds of 5.93% and 3.95%. For investors confident that the tax-free status of municipal bond interest is safe, the available 6.0% to 7.0% tax-equivalent yields (assuming the highest Federal marginal tax rate) are noteworthy.
“The plain fact is inflation is too high and has been for too long.”
Federal Reserve Chair Kevin Warsh on September 16, 2026
A strong economy, consumer price data, and Federal Reserve Chair Warsh’s hawkish comments at the September meeting are all cited as reasons for the recent bond sell-off. Moreover, while the implications of the U.S.’s deteriorating fiscal profile are often discussed, reaching $40 trillion of debt in August seems to have triggered additional angst over the United States’ long-term credit profile. As outlined in the chart below, debt-to-Gross Domestic Product remains below the World War II and COVID-19 peaks. Yet it now exceeds the levels seen during the Great Financial Crisis and the Great Depression. Unfortunately, today’s 100% debt-to-GDP ratio highlights the increase in U.S. debt, since, unlike some prior peaks, we are not in an economic recession.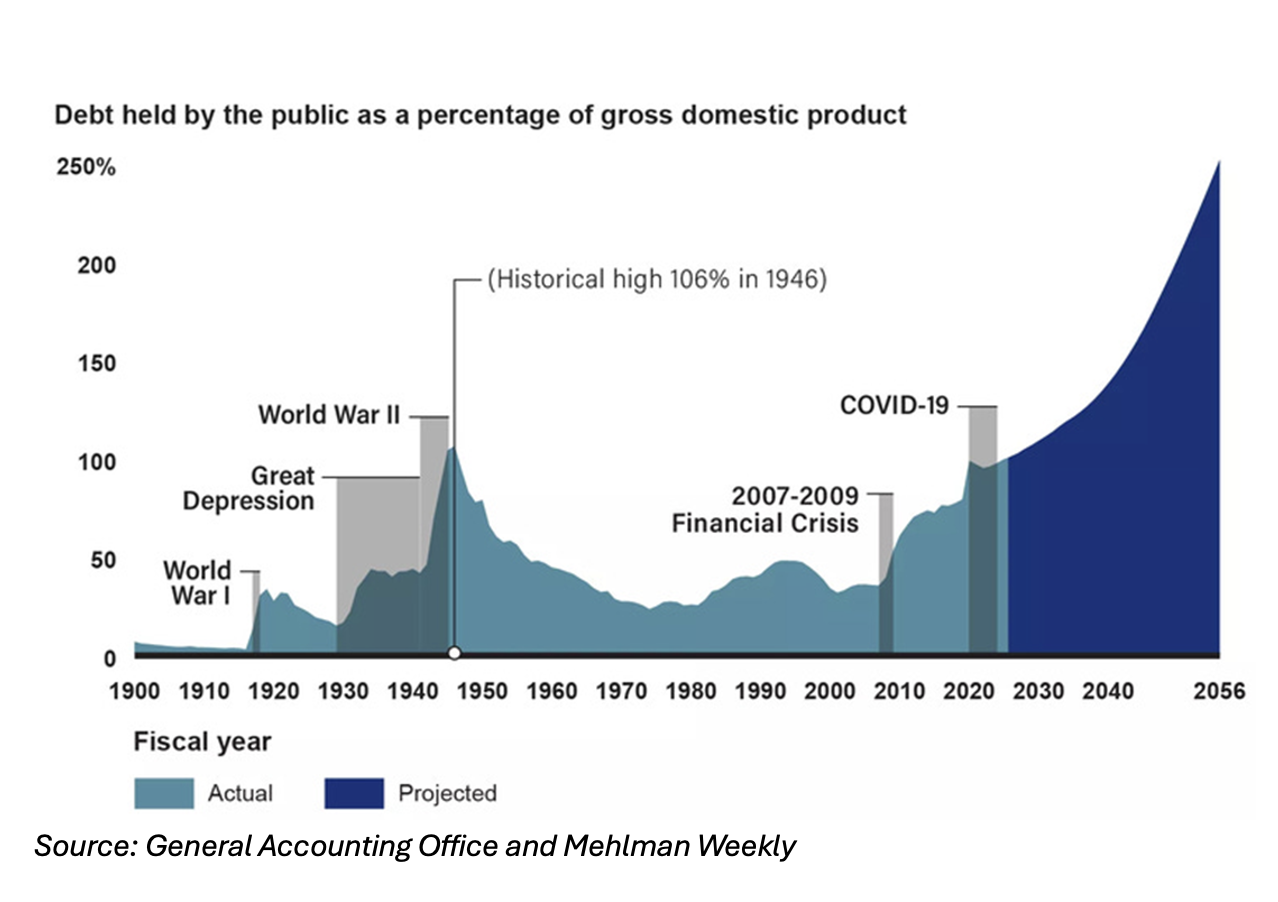
Bonds Are Cheaper, So We Are Adjusting Portfolios
Our approach to fixed-income investing is conservative. After all, this is the portion of the portfolio we can access when either 1) it would be disadvantageous to sell stocks to raise cash during a market downturn or 2) we want to opportunistically purchase additional equities during a significant market decline. Consistent with this conservative approach, we have historically kept duration relatively short and mostly purchased investment-grade bonds.Some of the highest yields in two decades, however, have created opportunities. In recent weeks, we have swapped bonds maturing in the coming months for bonds maturing in four or five years. We have also added actively managed fixed-income ETFs to many portfolios. The goal is to increase diversification into mortgages and certain global debt at a time when the additional yields can materially enhance a portfolio’s income visibility.
Our sensitivity to the risks of persistent inflation, record levels of government deficits and debt, and historical yield context (i.e., the 1970s and 1980s) means we will keep fixed-income portfolio duration well below the benchmarks. We will also maintain our investment-grade focus. However, just as we want to own more stocks when they become less expensive, we want to capture more yield when interest rates rise, and the risk-adjusted return outlook improves.
A Rush to Year-End and Another Election Season
No one needs to be reminded how busy life and work are between now and year's end. For our clients, tax strategy and planning, required minimum distributions, charitable giving, and estate activities often accelerate in the fourth quarter. If you have questions on any of these fronts, please contact us. As you know, we are an investment and wealth management firm. And while investments and economic developments are the focus of this commentary, our experience is that sound financial planning, consistent with one’s objectives, will prove comforting amid periods of uncertainty.“The future of the republic is in the hands of the American voter.”
President Dwight D. Eisenhower
“We always want the best man to win an election.
Unfortunately, he never runs.”
Will Rogers
As if the typical fourth-quarter rush were not enough, the November mid-term election season is certain to garner investors’ attention. It is too difficult to forecast results, let alone how November could impact the policy agenda. In fact, if we have learned anything in recent years, it is that traditional party priorities can shift quickly and that “politics can make strange bedfellows.” Throw the looming Social Security Trust Fund crisis in the mix (benefits will be reduced roughly 20% across the board in 2032, assuming the status quo), and the legislative sausage-making in the next few years could prove as volatile as ever.The good news is, as we discussed in our July commentary, our system allows the American people to weigh in every two years. That means if one Congress or political party whiffs, another should soon get a chance. And, most gratefully, as we were reminded in recent weeks, America is incredibly resilient and full of unsung heroes.
Thank you, as always, for your continued trust and confidence. We wish you a wonderful fall season and look forward to answering your questions.
The Woodmont Team
October 2, 2026
This document contains general information only and is not intended to be relied upon as a forecast, research, investment advice, or a recommendation, offer, or solicitation to buy or sell any securities or to adopt any investment strategy. The information does not take into account any reader’s financial circumstances or risk tolerance. An assessment should be made as to whether the information is appropriate for you with regard to your objectives, financial situation, present and future needs.
The opinions expressed are of the date of publication and may change as subsequent conditions vary. The information and opinions contained in this material are derived from proprietary and non-proprietary sources deemed by Woodmont to be reliable, are not necessarily all inclusive and are not guaranteed as to accuracy. There is no guarantee that any forecasts made will come to fruition. Any investments named within this material may not necessarily be held in any accounts managed by Woodmont. Reliance upon information in this material is at the sole discretion of the reader. Past performance is no guarantee of future results.